DIY Tuxedo Monitoring - ULOG and TMTRACE
Going the least painfull way I wrote a Python script that analyzes Oracle Tuxedo user log entries and extracts trace information from it. It’s pretty easy to do, does not require compilation of some C code for a specific platform and user log can be analysed offline on my laptop instead of server itself. The downside of that is writing verbose trace file which takes both disk space and time.
So by default each user log entry has a coarse grained timestamp down to seconds. To get timestamp with milliseconds you must export environment variable before starting the application.
ULOGMILLISEC=Y; export ULOGMILLISEC
And then Oracle Tuxedo trace can be turned on and off while the application is still running by using tmadmin:
# on
echo 'chtr "*:ulog:dye"' | tmadmin
# off
echo 'chtr off' | tmadmin
If you have Tuxedo client applications that call server applications you should also export the environment variable:
TMTRACE=on; export TMTRACE
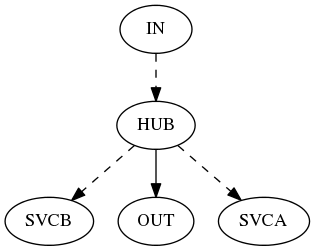
So far I have found two useful output formats. The first one is a diagram with service call graph that gives the impression of how complex the application is:
python ulog-trace.py log/ULOG.040516 -G -O callgraph.png
Gives output like this one (for my simplified demo application):
The second output format is similar to text-mode profiler output. But it shows Tuxedo services instead of functions and number of times the service was called and cummulative time. It also shows direct callees of the service, number of times it was called and cummulative time spent calling it. One thing to keep in mind is that time spent calling service will be greater (and can be much greater) than time executing service because of asynchronous nature of the call and queues involved.
python ulog-trace.py log/ULOG.040516 -T
For the same demo application gives:
HUB                                40  3.458000
    tpcall(OUT)                    40  1.746000
    tpacall(SVCB)                  40  0.008000
    tpacall(SVCA)                  40  0.006000
IN                                 40  2.769000
    tpacall(HUB)                   40  0.007000
OUT                                40  1.734000
SVCA                               40  1.710000
SVCB                               40  1.682000
If this sounds iteresting to you, give it a try. For diagram output you must have Graphviz binaries and Python module “pydot” installed.